Marketing Performance Reporting
No More Report Anxiety
Are you rushing around the night before a board meeting trying to get website reports assembled from countless sources? Make your data easier to understand and easier to access.
Imagine The Time You’LL Save
- No more gathering reports from 10 different browser tabs
- No more screenshots cluttering your desktop
- No more cutting and pasting data cells
- No more trying to align reporting dates
- Your data is displayed in an easy-to-understand report that can be shared, printed, or emailed
How Does the Dashboard Work?

- Each flow of data is presented in a variety of visual formats that make understanding data easier
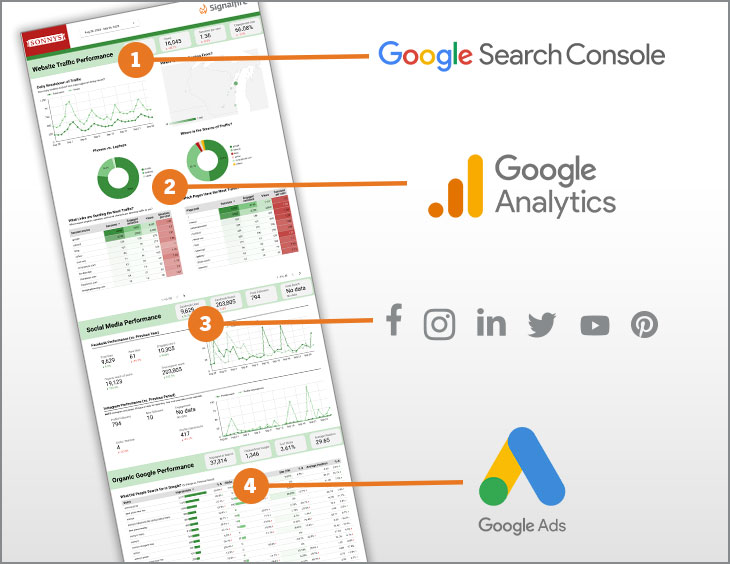
- Assemble data from your website, Google searches, and even your Pay-Per-Click search ads
- Expand the dashboard by connecting independent social channels such as Facebook or LinkedIn—even connect your email newsletter platform!
How Does My Data Look?

- Signalfire identifies your key performance indicators (KPIs) and how to best visualize it
- We begin connecting or mapping the data and the resulting dashboard gives you a critical performance display
- Reporting is not set in stone! Over time and as strategy evolves, Signalfire provides updates to display the most critical data