Data Audit Reveals advertising wasn’t directed to top-performing cities
Just imagine your destination marketing organization’s (DMO’s) ad budget has been focused on a specific metropolitan area for almost a decade. Google Ads, Meta, and pre-roll video ads running at a steady rate.
It made sense. They were a major city in a neighboring state. The ad provider was reporting a significant number of clicks.
In late 2024 Signalfire conducted an audit or data deep dive into where their website traffic came from, where the vacation guides were being requested, and the reports provided by multiple advertising partners.
The results froze the DMO in their tracks.
An overwhelming majority of the ad money—thousands each year—was being spent on a community barely in the top 10! Other major areas in the the top 10 weren’t even on the DMO’s radar.
Independently monitoring your marketing and website performance is crucial.
How To Prevent This From Happening to You
- Make sure you have Google Analytics, Google Tag Manager, and other monitoring tools set up on your website
- Make sure your advertising has dedicated landing pages (not just your homepage)
- Use Google’s UTM code generator to create campaign links that flag ad-generated traffic
- Review your data once a month (at least)—especially when ads are running
What Data Metrics Should I Look At?
If you have Google Analytics set up, we recommend keeping an eye on a couple specific metrics:
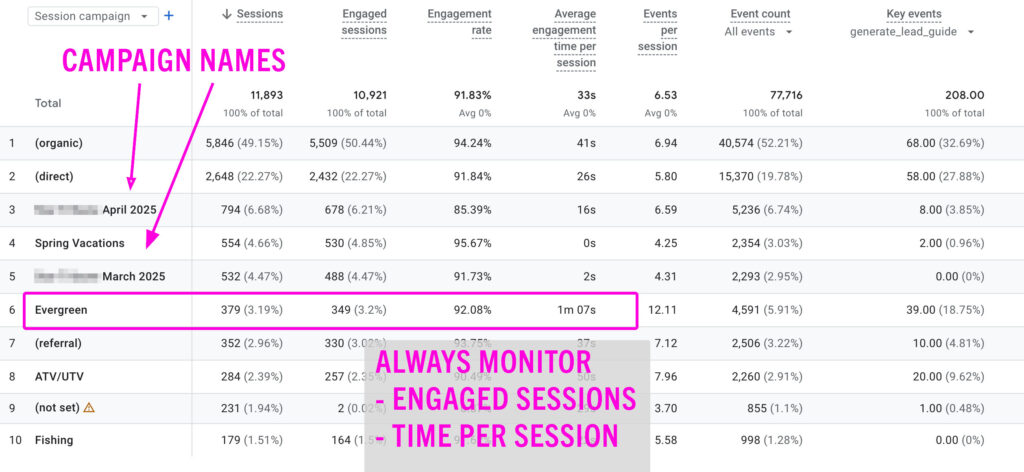
Engaged Sessions
Google Analytics will report an engaged session when a session lasts longer than ten seconds, when a session includes at least one conversion, or when a session includes two or more page views. This will track the users who are intentionally on the website and not a “bounce.”
Signalfire recommends comparing this number to the same time period the year prior.
This number should be compared to Active Users (engaged humans visiting the website).
Average Engagement Time per Session
Average engagement time tells you the average amount of time people spend on your website or app. This metric is calculated by dividing the total time by the total number of users. The Session value is calculated by dividing the total time by the total number of sessions.
How much time is spent on your website is a solid indication of how useful the site is for your future guests. You should track how this number changes compared to the year previous.
Key Events (if it’s setup)
Key events are definable “actions” taken by website visitors. Events can be configured in Google Analytics to be “triggered” when website visitors perform specific activities such as clicking a link, completing an online form, or watching a video to the end.
Completing these key events can be tracked as “conversions” in situations common to destination marketing organizations. Since it is difficult to assign direct dollar-values to these actions, these conversions are difficult to measure for ROI.
What If We Need Help?
Feeling overwhelmed by the data-side of things? You are not alone! Our team can help get your data reporting where it should be. Different ways we help you:
- Provide a marketing performance audit (we call it a MAP)
- Setup and configure Google Analytics, Google Search Console, and other needed tools
- Create a data dashboard that cuts the time needed to generate reports to almost zero
- Monthly consulting calls to help review data and assess ad performance
To get started—just setup an appointment!